
Accessible Math Checklist
- Create documents in a typed format with the use of equation editors (instead of handwriting documents)
- Organize equations in a linear and consistent format
- Add captions to figures, drawings, and graphs
- Choose high contrast colors, thick lines and points, and implement additional signifiers for graphs
- For hand drawn figures, use clean, blank paper and create high resolution scans, or use a computer drawing application
Why Typed Math is Important for Accessibility
Typed text is more legible for those with cognitive or visual difficulties and/or disabilities including dyslexia, dysgraphia, low vision, color blindness, and more. Variations in handwriting style, skewed text, writing that is too small or too big, block vs. cursive writing, and more can make handwritten text and math difficult to decipher. As such, it is highly recommended to work with typed text and equations over handwritten math.
We recognize that an advantage of handwritten text for math is the flexibility of formatting. When handwriting, you can use arrows to comment on an equation, place equations side by side, draw and annotate figures. Because of this flexibility, handwritten text often does not maintain a consistent, linear format. This can make the order of text difficult to follow and some students may have trouble organizing equations in their mind. It can also lead to students missing information that is outside the main flow of the document (such as notes or equations in the margins) or interpret information out of order due to inconsistent formatting and flow. Additionally, handwritten text is often not compatible with technology such as screen masking, the process of highlighting a single line of text and moving through the document line by line, since content is not organized in a linear format.
Lastly, handwritten text is likely to become a scan of a physical copy; as with scanned copies of textbooks or other physical material, scans of handwritten math often become distorted, low contrast, and/or low resolution. This can increase barriers for students, particularly when it limits students’ ability to zoom in on text. Typed text ensures that students have access to source material, which they can smoothly convert to a more accessible format. This may include zooming, adjusting text or background colors, using screen maskers, using document readers for non-math text, and more.
Implementing Accessible Math Guidelines
Create documents in a typed format with the use of equation editors (instead of handwriting documents)
There are a variety of tools that can be used to create documents in a typed format. These include higher level math tools, such as MatLab and LateX documents, as well as normal text editors such as Microsoft Word and Google Docs. In general, less specialized technology will likely have more accessibility options. The Microsoft Suite, particularly Word and OneNote, may be good options for accessible, written math content. Both feature an advanced equation editor that can take unicode, LaTeX, and plain text inputs, as well as handwriting to text features. Additionally, the Read Aloud document reader built into these programs can read equations in a natural sounding way.
Organize equations in a linear and consistent format
As with non-mathematical text, it is important to maintain consistent formatting of content. This includes using headings, laying out content in a linear format, and using a consistent style to differentiate questions, deliverables, etc. from other content in the document. But there are also math specific formatting recommendations.
Specify (Visual) Reading Order
When it comes to written text, the order in which to read it is usually intuitive. This is not always the case with equations and math. For example, consider a problem that provides three equations with three variables and asks students to solve for one of the variables.
Method 1
Given \( x = 3\) and \(y = 3x-z\) and \(z - 2y\), solve for \(z\)
Method 2
Solve for z using the following equations.
\(\left [ 1 \right ]~x = 3 \quad \left [ 2 \right ] ~ y = 3x-z \quad \left [ 3 \right ] ~ z = 2y\)
Of the two methods above, Method 2 is more accessible for both visual and screen reading because it employs three accessible reading order practices. First, it provides the goal (solve for z) separate from the additional information (the equations). Second, it uses a clear additional signifier, numbering, to specify a reading order for the equations. Providing a linear reading order doesn’t mean that equations MUST be read in that order; its purpose is to provide a default structure for those that benefit from it, such as students with visual tracking difficulties or someone using a screen reader. Lastly, Method 2 incorporates additional whitespace to visually separate equations.
In times when equations should be read in a specific order, such as steps in a solution guide, it can be useful to use a combination of order signifiers. It is recommended to use one line per equation and to implement numbers. For example, an accessible solution guide to the above problem might look like this.
\[\begin{align} \left [1\right]\quad & y = 3(3)− z \\ \left [2\right]\quad & z = 2(9−z) \\ \left [3\right]\quad & z = 20−2z \\ \left [4\right]\quad & 3z = 18 \\\left [5\right]\quad & z = \frac{-b\pm\sqrt{b^2-4ac}}{2a} \end{align}\]
One Task per Bullet
When using numbered or bulleted lists, for example to lay out a list of homework questions, keep to one task per bullet. For example, a question asking students to find the derivative of an equation and create a graph containing the equation and its derivative might be written in the following ways.
Method 1
- Graph \(y=x^2+3x\) and its derivative on the same graph.
Method 2
- Find the derivative of \(y=x^2+3x\).
- Graph the above equation and its derivative on the same graph.
Method 3
For the equation \(y=x^2+3x\)
- Graph the equation.
- Find the derivative of x.
- Graph the derivative on the same graph as the equation.
In the above examples, each method further breaks down the question into specific tasks. The decision of which method to use, and how detailed to be when breaking down a question, is highly dependent on context. For a student’s first derivatives homework, Method 3 is likely the most accessible. For a seasoned student, Method 3 may be too detailed and Method 1 more appropriate.
Creating a solid match between the level of detail and the student’s skill level is necessary to provide a useful order to solve the question. With Method 3, new students might use the first graph to theorize what the derivative will look like before solving it numerically. These students will likely gain value from solving the problem in this order and have an easier time approaching the problem. Method 1 encourages students to use their own order to solve the question and develop the skills necessary to parse a larger question into smaller pieces. No method is necessarily more accessible than the other, but inaccessibility occurs when the chosen method does not match with the student’s skill and comfort level.
Implement Consistent Equation Alignment
A simple tip for consistent formatting is to choose either left or center aligned equations and stick to the same alignment whenever possible. There aren’t significant accessibility advantages to either format, though centering equations is an easy way to provide additional whitespace to separate equations from text.
Use Formatted Equations in Blocks of Text
When referencing equations in a block of text we suggest that you include the equations in symbolic form rather than referring to them in plain text. For example, we using "the triangle's largest angle is \(\theta = 30^{\circ}\)" rather than "the triangle's largest angle is theta equals 30 degrees". This maintains consistency across all equations and helps distinguish the equations from the surrounding text. Even when equations could be easily written in plain text it is a good idea use the equation editor (or other formatting engine, such as LaTeX).
This is an equation formatted using LaTeX: \(a+b=3\).
This is an equation written in plain text: a + b = 3.
Add captions to figures, drawings, and graphs
Like images, drawings and graphs should include captions to describe the content of the figure. Captions can be useful for those who have difficulty processing visual information. Some things that might be useful to mention in a caption include reiterating information stored in a legend (e.g. “the purple line, which represents velocity, …”), describing attributes of a drawing (e.g. “the S-shaped course”), or pointing students to important information (e.g. “Notice the drop at t=6.”).
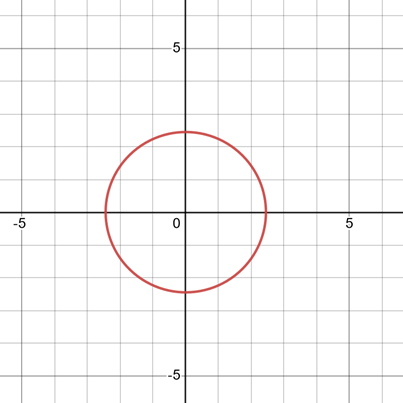
Note that captions and alt text are not the same; captions describe the context of a visual figure while alt text describes both the context and the content of the figure. For example, for the graph below, the caption might be ‘A graph of the equation \(x^2+y^2=6\)’. The alt text for the graph would be ‘A graph of the equation x squared plus y squared equals 6. A red circle centered at the origin, 0,0, with a radius of the square root of 6. X and Y axes from 5 to -5 shown.’
Choose high contrast colors and implement additional signifiers for graphs
Graphs in math texts often convey vital information; as such they must be easily readable by students with low vision, color blindness, or other difficulties. Like with other graphical components, choosing high contrast colors and implementing additional signifiers is the most accessible way to create a vision-accessible graph.
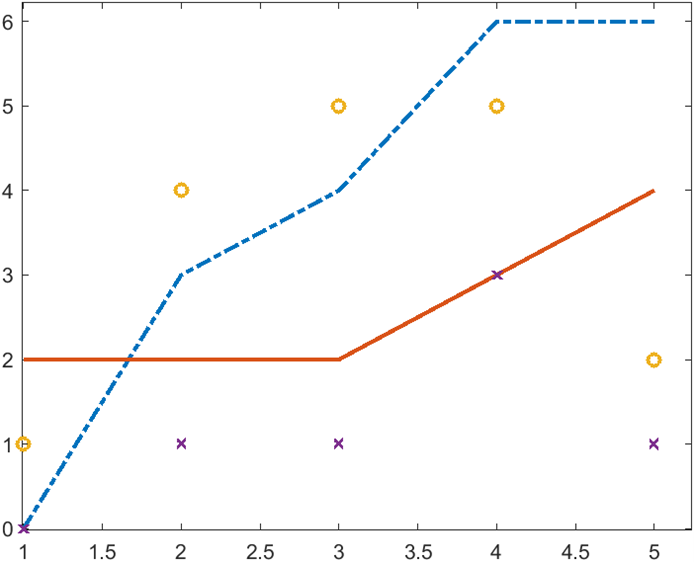
In MatLab, the default blue and orange graph colors have sufficient contrast to the white background and should be used when possible. An important modification to MatLab graphs, which may be useful for graphs created in other formats as well, is to increase the line thickness (known as LineWidth) up to 2 or above. The default MatLab line thickness is very thin (less than 1 LineWidth) and can make lines difficult to see; this small change can drastically increase visibility. For increased color blindness visibility, using lines with different styles (known as LineStyle) is an easy way to add an additional signifier. Similarly, when plotting points, increasing the line thickness and using a variety of different point styles will increase visibility. Below are two MatLab graphs; the first demonstrates the poor accessibility of default options, the second is the same graph made more accessible through LineWidth and other style changes.


Left: Inaccessible Graph. Right: Accessible Graph.
One thing to notice is that even with the accessible graph, information that is touching the edges of the graph (such as the first and last set of points and the last piece of the blue line) is easy to miss. In such cases, it may be useful to extend the boundaries of the graph so that information is more visible. Note that even when extending the boundaries, it is usually a good idea to leave the origin where it is and extend the right and top bounds, unless there is very important graphical information that is being obscured near the origin. In the graph below 0.25 units of space was added to the right and top of the graph using xlim and ylim.
For hand drawn figures, use clean, blank paper and create high resolution scans
Hand drawn figures can be a quick and useful way to convey information. When possible, creating these drawings with a computer drawing tool will yield a high contrast, high resolution drawing. But such figures can also be accessible when drawn on physical paper as long as they are created on clean, blank paper (not lined or graph paper) and scanned in high resolution. The best way to scan in a hand drawn figure is using the library document scanner, but a clean scan from a printer or a phone app will likely be sufficiently high contrast and high resolution. Be careful to only use dark colors when hand drawing, as colors will decrease in saturation when scanned. Black and dark blue are the best options for hand drawn figures. Generally, it is inadvisable to use a lot of colors in a hand drawn figure or to use color as a signifier; a computer drawing application would be a much better choice in these instances.
Typesetting Math on the Web
There are some nice solutions to creating beautiful, typeset equations for the web. As a bonus, these formats often are more accessible for screen reader users than equations in PDFs and other document formats. If you are considering having math on the web, we recommend you use the MathJax library. MathJax can be added to your website by including a single javascript file in the <head> section of your HTML file (see the Getting Started with MathJax Components section of the MathJax documentation for details).
Once you've configured MathJax, you can add equations to your website in several different formats. Available formats include LaTeX, MathML, and Ascii math. We've tried the LaTeX input format (e.g., that's how we added the equations on this page!).
For example, the following code results in the equations to follow.
\[\begin{align}
[1]\quad & y = 3(3)− z \\
[2]\quad & z = 2(9−z) \\
[3]\quad & z = 20−2z \\
[4]\quad & 3z = 18 \\
[5]\quad & z = \frac{-b\pm\sqrt{b^2-4ac}}{2a}
\end{align}\]
\[\begin{align} \left [1\right]\quad & y = 3(3)− z \\ \left [2\right]\quad & z = 2(9−z) \\ \left [3\right]\quad & z = 20−2z \\ \left [4\right]\quad & 3z = 18 \\\left [5\right]\quad & z = \frac{-b\pm\sqrt{b^2-4ac}}{2a} \end{align}\]
One benefit of using MathJax is it has built-in screenreader support (this is because internally MathJax uses a format called MathML, which built in this support).
A Note on Screen Readable Math
With the exception of typesetting math on the web with MathJax, presently technology has not reached a point where it is viable to make equations screen reader accessible by default. To create natural language reading of equations it is often necessary to write out the equation in plain text manually and apply it as alt text to an image of the equation. Currently, we do not recommend focusing on creating readable equations and instead focus on other math accessibility best practices. We’ve found that the time investment for screen readable equations is not currently worth the benefit. That being said, screen readable math is possible and is a reasonable accommodation for some students.